
Page 5 - Atlas_2019_rus
P. 5
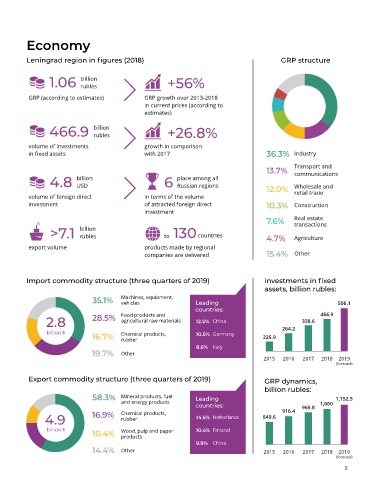
Economy


          Leningrad region in figures (2018)                                               GRP structure


                           trillion                   +56%
                 1.06 rubles

          GRP (according to estimates)         GRP growth over 2013-2018
                                               in current prices (according to
                                               estimates)

                               billion
                 466.9 rubles                         +26.8%
          volume of investments                growth in comparison
          in fixed assets                      with 2017                              36.3% Industry

                                                                                      13.7%    Transport and
                                                                                               communications
                         billion                          place among all
                 4.8 USD                             6 Russian regions                12.0%    Wholesale and
          volume of foreign direct             in terms of the volume                          retail trade
          investment                           of attracted foreign direct            10.3%    Construction
                                               investment
                                                                                      7.6%     Real estate
                                                                                               transactions
                          billion
                 >7.1 rubles                         to 130 countries                 4.7%     Agriculture
          export volume                        products made by regional
                                               companies are delivered                15.4%    Other


         Import commodity structure (three quarters of 2019)                         Investments in fixed
                                                                                     assets, billion rubles:
                              35.1%     Machines, equipment,   Leading                                       506.1
                                        vehicles
                                                               countries:                              466.9
                2.8           28.5%     Food products and       12.5% China                      338.6
                                        agricultural raw materials

                billion $               Chemical products,      10.5%  Germany             264.2
                              16.7%     rubber                                       225.9
                                                                8.6%  Italy
                              19.7%     Other
                                                                                     2015  2016   2017  2018  2019
                                                                                                            (forecast)
          Export commodity structure (three quarters of 2019)                        GRP dynamics,

                                                                                     billion rubles:
                              58.3%     Mineral products, fuel    Leading                                   1,152.5
                                        and energy products                                            1,060
                                                               countries:                  916.4  965.8
               4.9            16.9%     Chemical products,      14.5% Netherlands    849.6
                                        rubber
                billion $               Wood, pulp and paper    10.4%  Finland
                              10.4%     products
                                                                9.9%  China
                              14.4%     Other                                        2015  2016   2017  2018  2019
                                                                                                            (forecast)
                                                                                                                5